Charts
There are various charts with different periods and filet options. These let you take a look at your most important statistics without downloading a csv and operating in a third-party software.
Available charts may vary based on your access to the Product.
Summary Charts
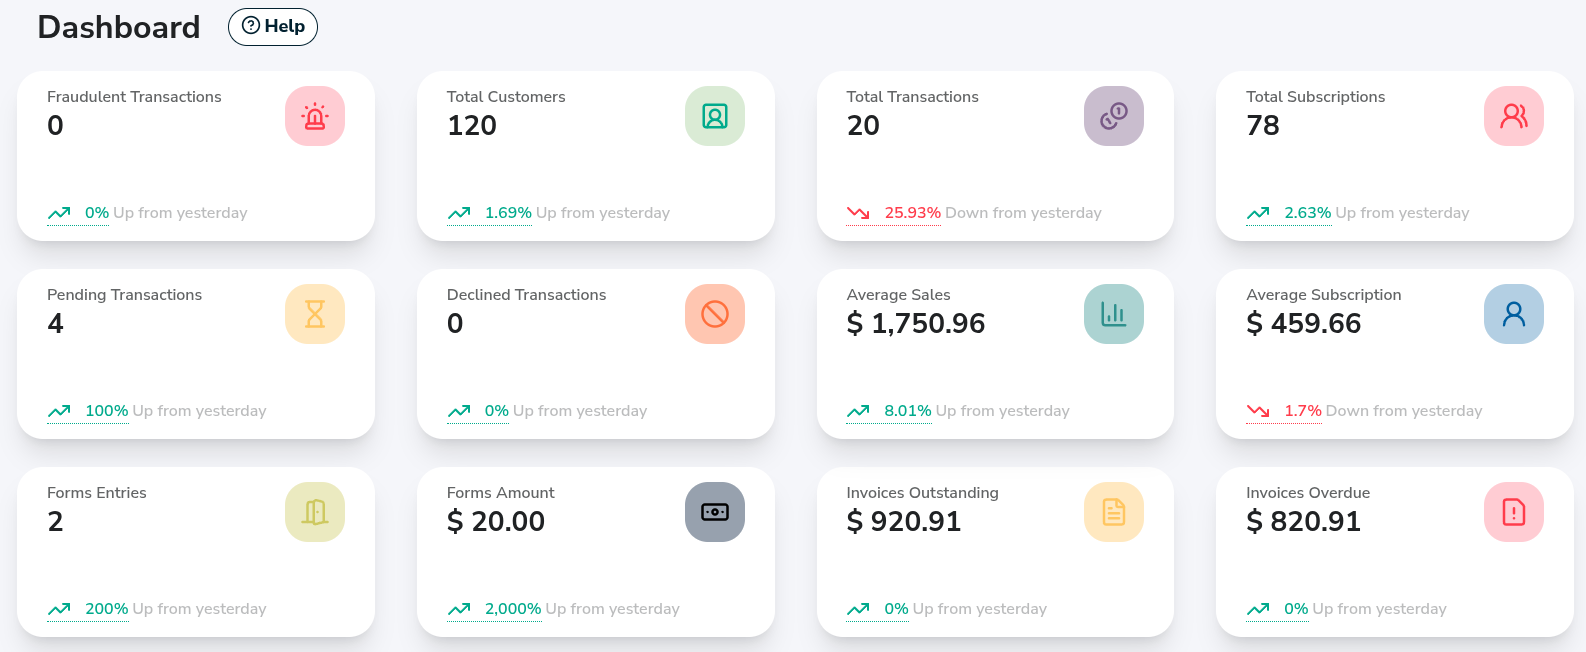
Summary Charts lets you see the number of transactions for today and yesterday.
Fraudulent transactions: the number of fraudulent transactions which have occurred today.
Total customers: the total number of Customer Vault records of the merchant.
Total transactions: the number of transactions which have occurred today.
Declined transactions: the number of declined transactions which have occurred today.
Pending transactions: the number of pending transactions which have occurred today.
Average sales: the average amount of the transactions which have occurred today.
Form amounts: the amount of the transactions which have occurred today.
Form entries: the number of form entries which have occurred today.
Total subscriptions: the number of active subscriptions.
Average subscription: the average amount of active subscriptions.
Invoices outstanding: the total amount of outstanding invoices.
Invoices overdue: the total amount of overdue invoices.
The percentage shows you the trend comparing today to yesterday. Hovering over the percentage shows you the exact amount in a tooltip.
Transaction Totals
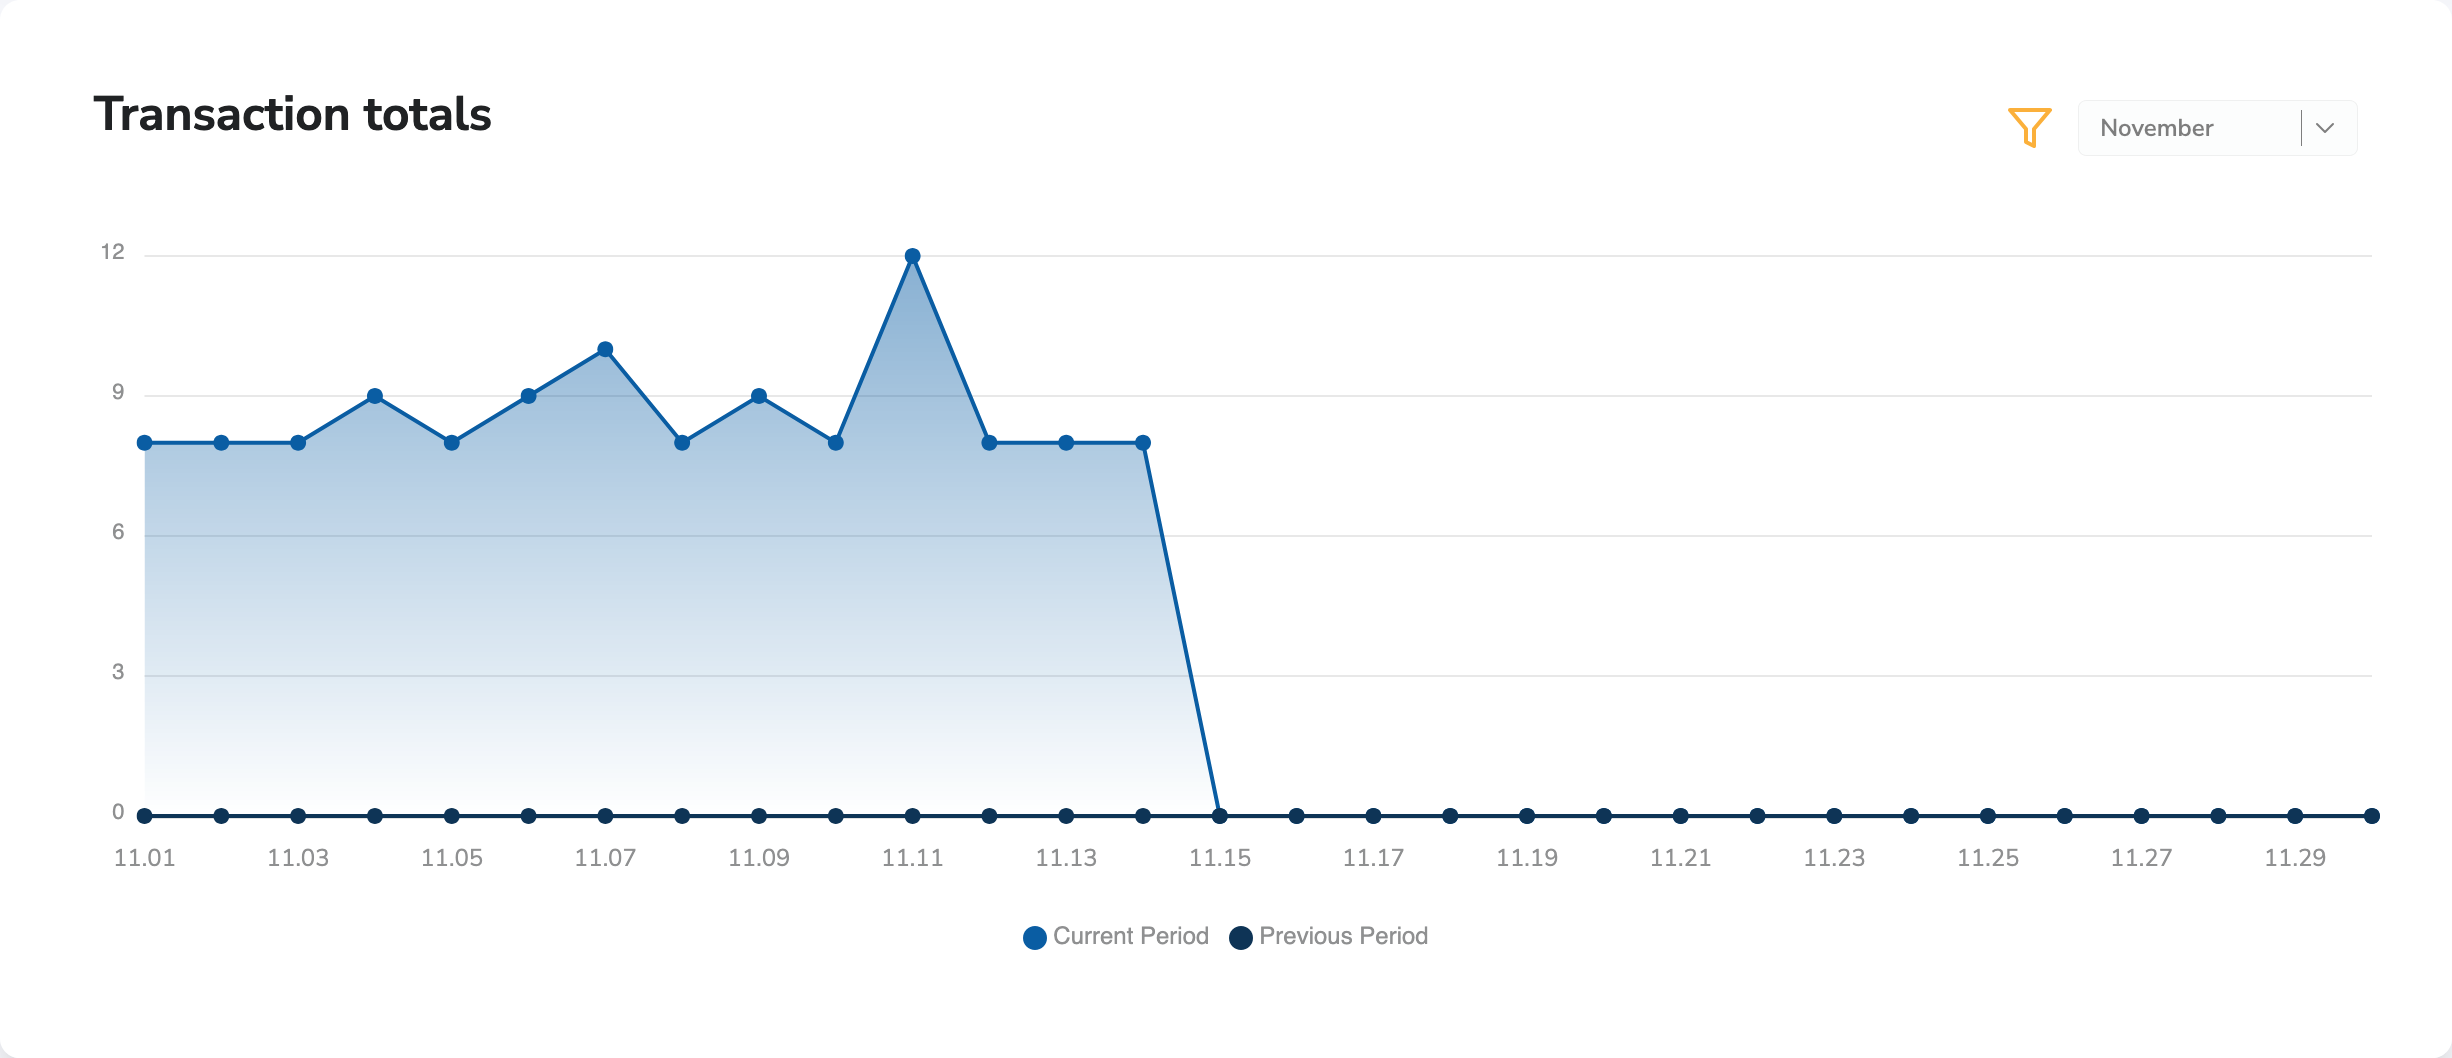
Transaction Totals chart lets you see the number of transactions on a given day displayed for a whole month.
Month dropdown: Choose the month that you wish to see. It is set to the current month by default.
Previous Period and Current Period: Hovering over a given day, you can see the current month compared to the save month of the given year.
Filter: Filter for your payment types. They are displayed with different colors for easier distinction.
Transaction Charts
Fraudulent Transaction
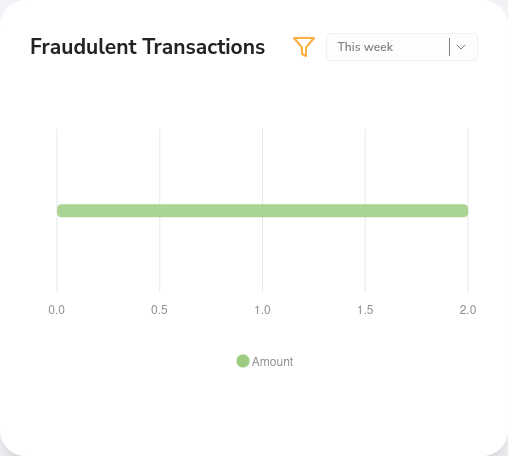
Fraudulent Transaction chart shows you the amount of transaction attempts which are labeled fraudulent. The displayed period shows you the current week.
Week dropdown: Choose the week that you wish to see. It is set to the current week by default. You can even choose a custom week to display. The previous week will be the week before the chosen one.
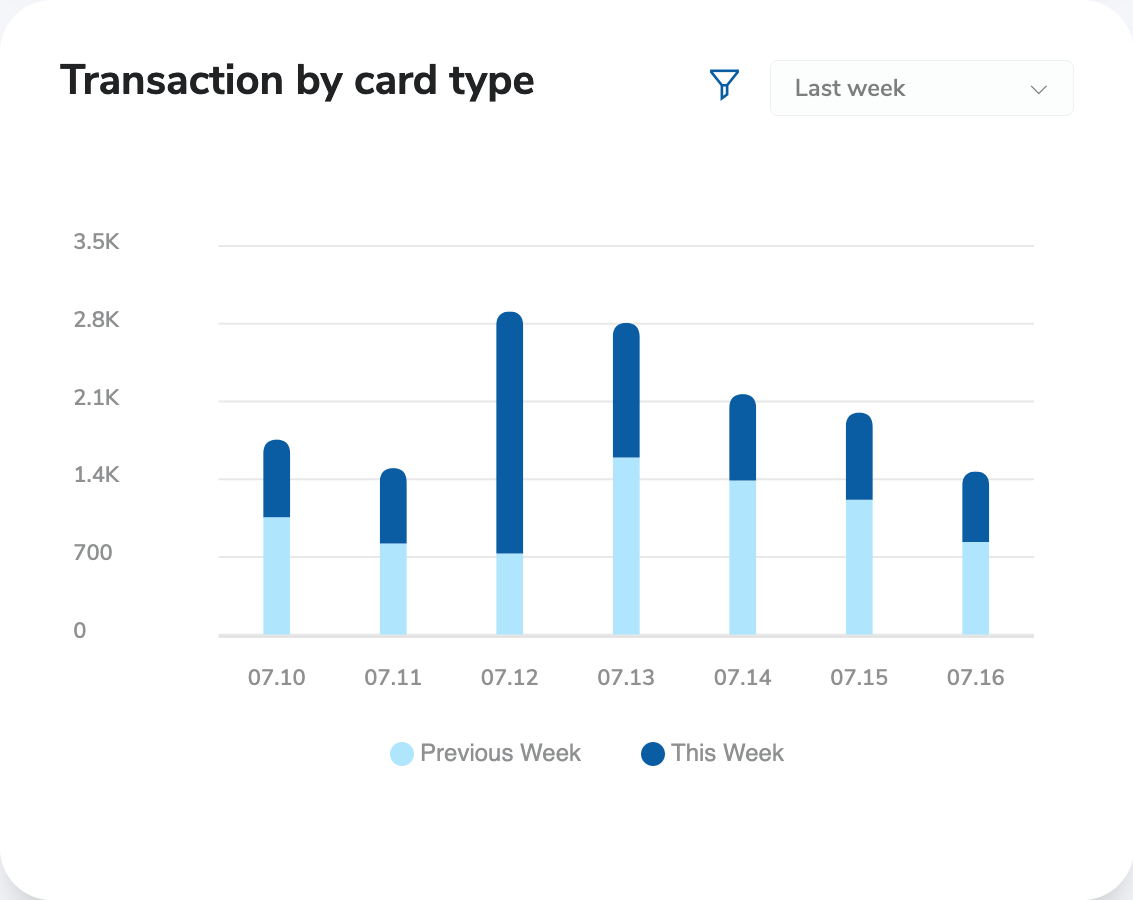
Transaction by Card Type
Transaction by card type chart shows you details about the distribution of transactions between card brands. The displayed period shows you the current week and the week before in daily distribution.
Week dropdown: Choose the week that you wish to see. It is set to the current week by default. You can even choose a custom week to display. The previous week will be the week before the chosen one.
Filter: Filter for card brands. They are displayed with different colors for easier distinction.
Transaction by Processor
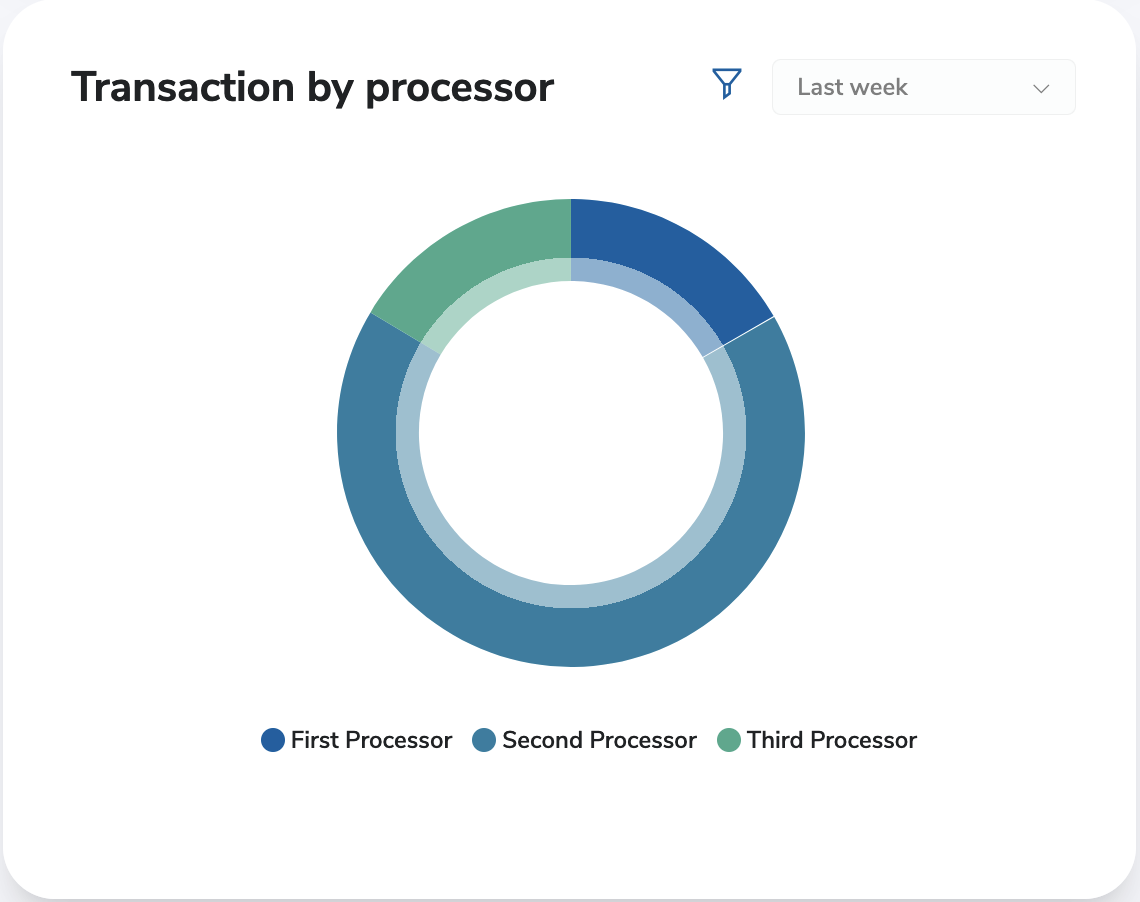
Transaction by processor chart shows you details about the distribution of transactions between your processors. The displayed period shows you the current week and the week before in daily distribution.
Week dropdown: Choose the week that you wish to see. It is set to the current week by default. You can even choose a custom week to display. The previous week will be the week before the chosen one.
Filter: Filter for your processor. They are displayed with different colors for easier distinction.
Volume Charts
Volume by Currency
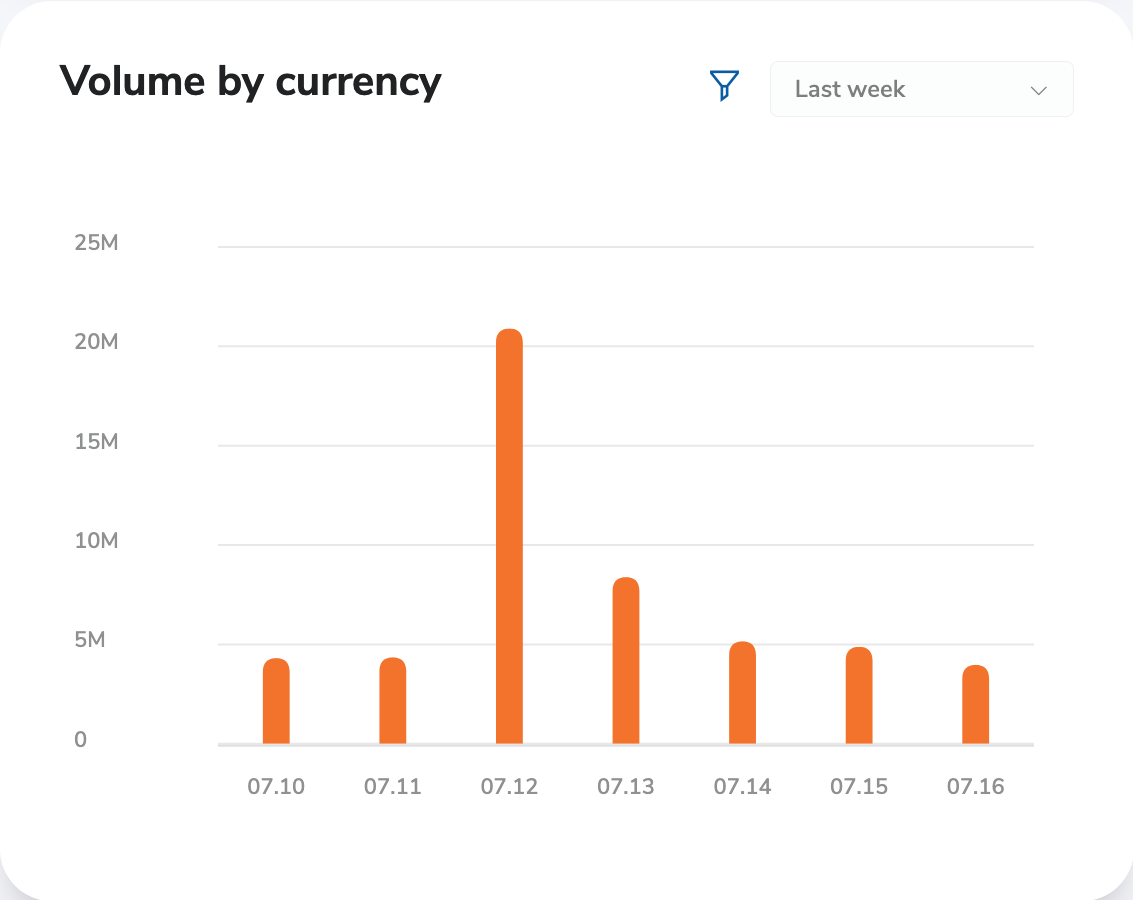
Volume by currency shows you the volume of transactions between currencies. The displayed period shows you the current week and the week before in daily distribution.
Week dropdown: Choose the week that you wish to see. It is set to the current week by default. You can even choose a custom week to display. The previous week will be the week before the chosen one.
Filter: Filter for currencies. They are displayed with different colors for easier distinction.
Volume by Processor
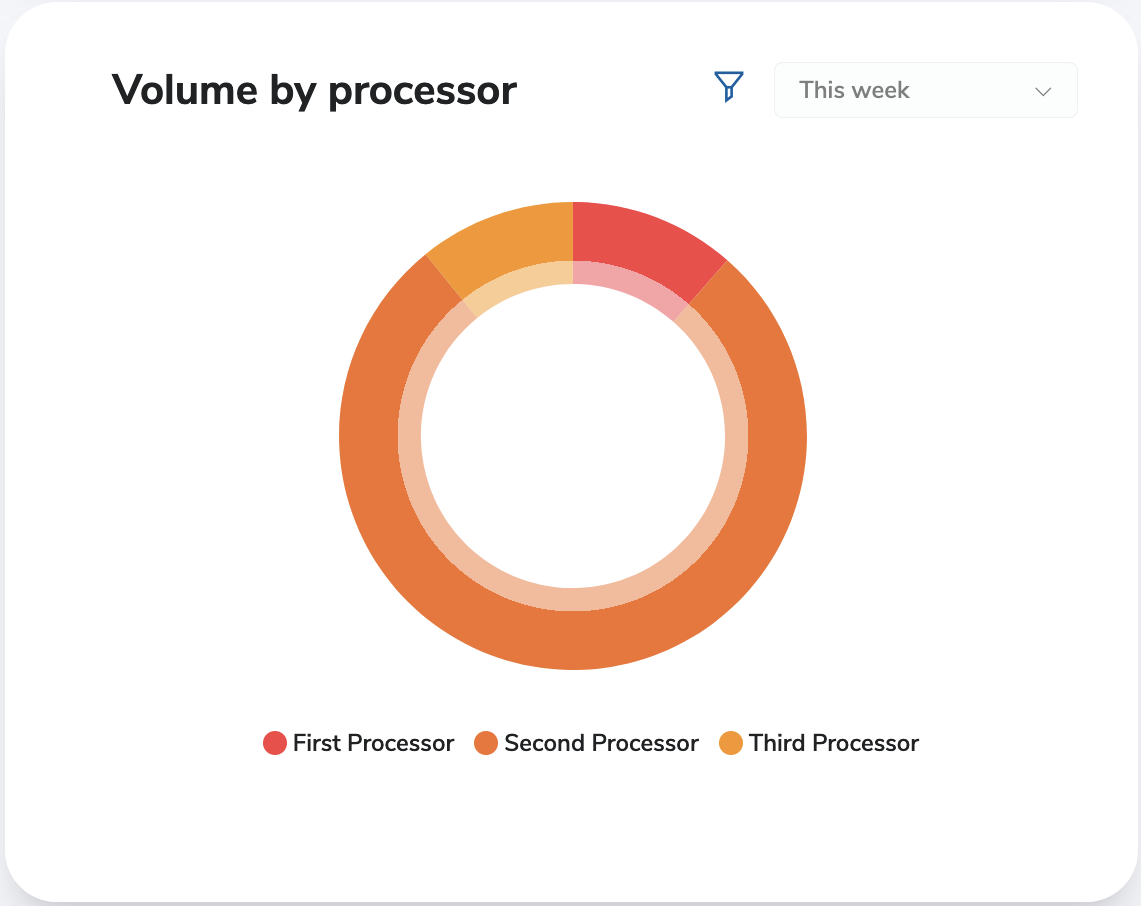
Volume by processor shows you the volume of transactions between processors. The displayed period shows you the current week and the week before in daily distribution.
Week dropdown: Choose the week that you wish to see. It is set to the current week by default. You can even choose a custom week to display. The previous week will be the week before the chosen one.
Filter: Filter for processors. They are displayed with different colors for easier distinction.
Volume by Card Type
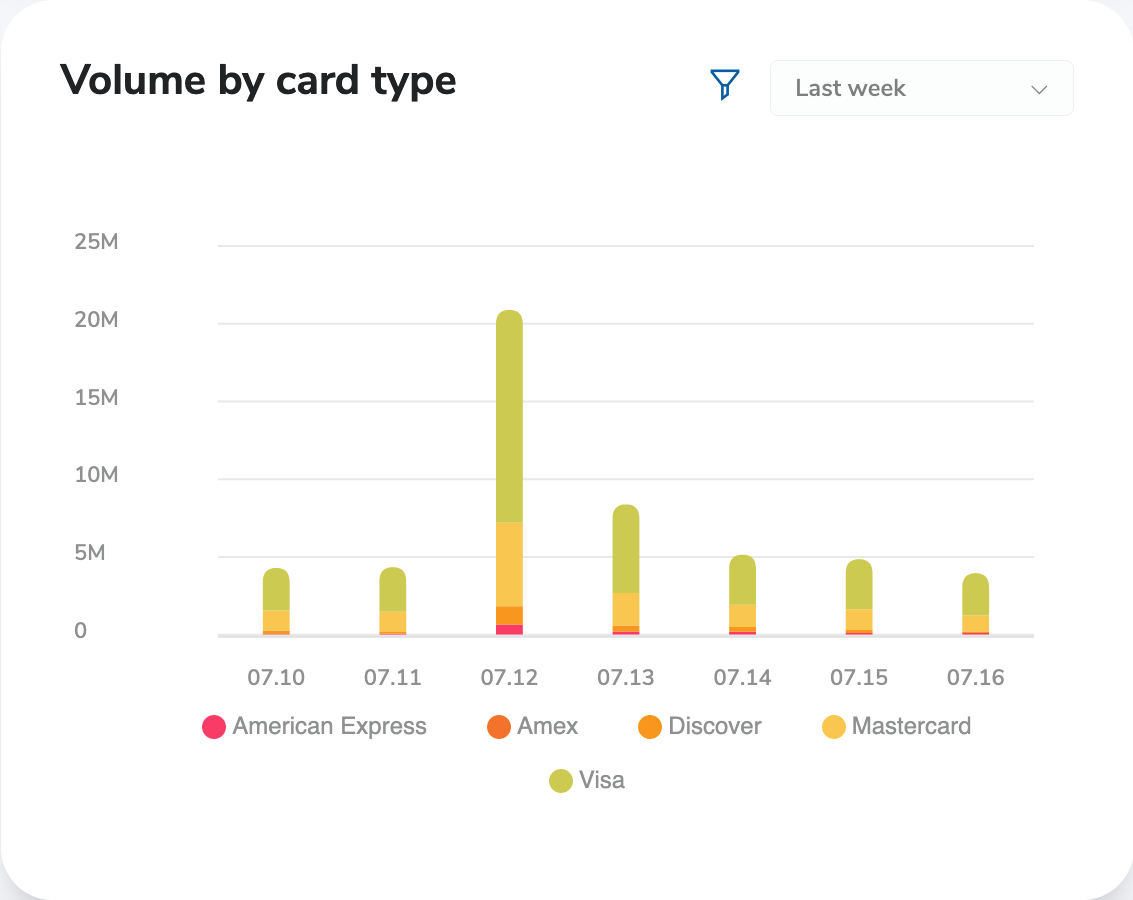
Volume by card type chart shows you the volume of transactions between card brands. The displayed period shows you the current week and the week before in daily distribution.
Week dropdown: Choose the week that you wish to see. It is set to the current week by default. You can even choose a custom week to display. The previous week will be the week before the chosen one.
Filter: Filter for card brands. They are displayed with different colors for easier distinction.
Decline Charts
Declines by Currency
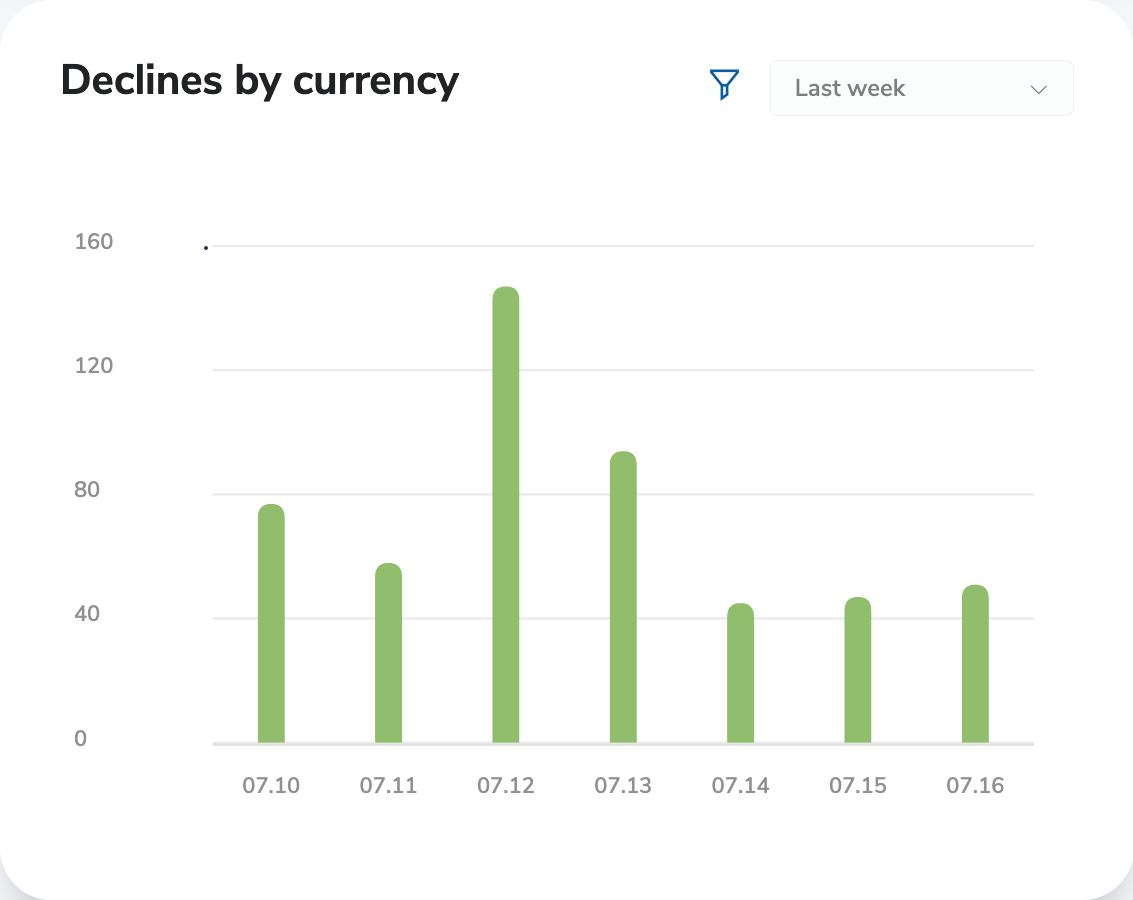
Declines by currency chart shows you the number of declines for currencies. The displayed period shows you the current week and the week before in daily distribution.
Week dropdown: Choose the week that you wish to see. It is set to the current week by default. You can even choose a custom week to display. The previous week will be the week before the chosen one.
Filter: Filter for currencies. They are displayed with different colors for easier distinction.
Declines by Card Type
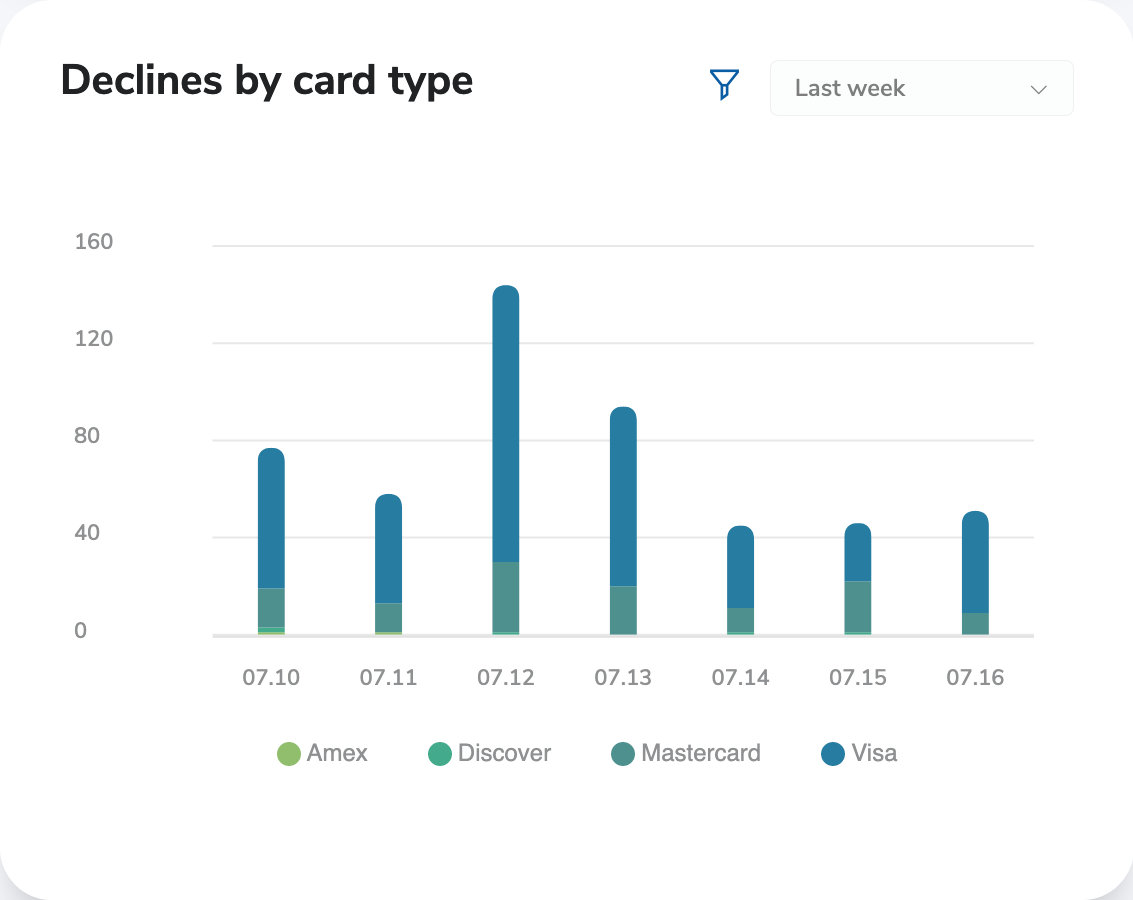
Declines by card type chart shows you the number of declines for card brands. The displayed period shows you the current week and the week before in daily distribution.
Week dropdown: Choose the week that you wish to see. It is set to the current week by default. You can even choose a custom week to display. The previous week will be the week before the chosen one.
Filter: Filter for card brands. They are displayed with different colors for easier distinction.
Declines by Processor
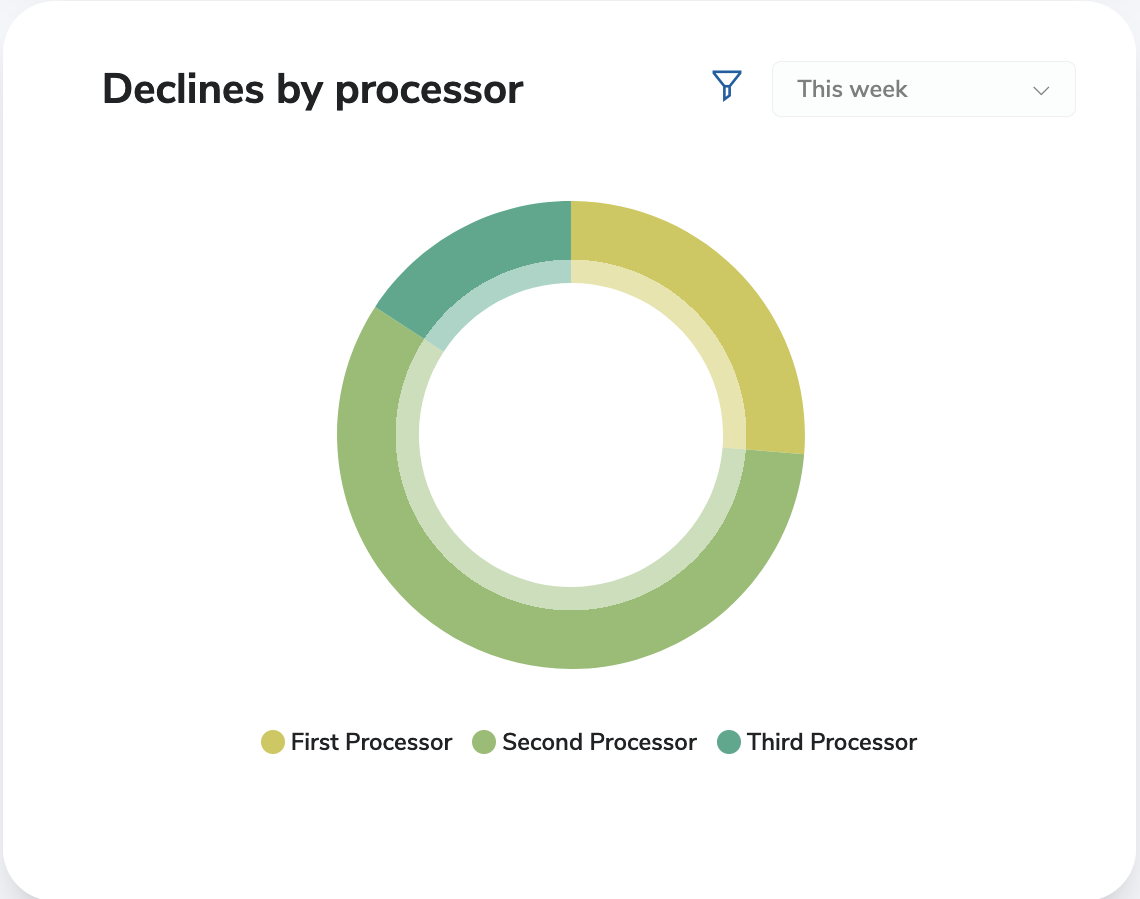
Declines by processor shows you the number of declines for processors. The displayed period shows you the current week and the week before in daily distribution.
Week dropdown: Choose the week that you wish to see. It is set to the current week by default. You can even choose a custom week to display. The previous week will be the week before the chosen one.
Filter: Filter for processors. They are displayed with different colors for easier distinction.
Invoice Charts
Invoices by Status
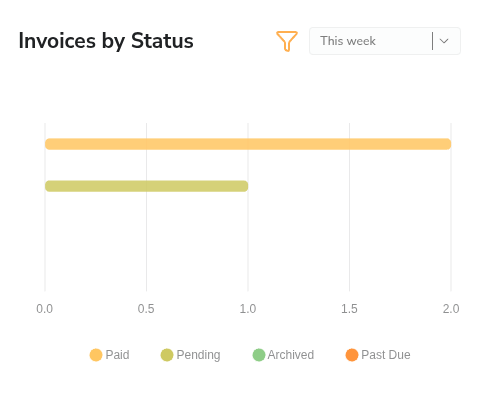
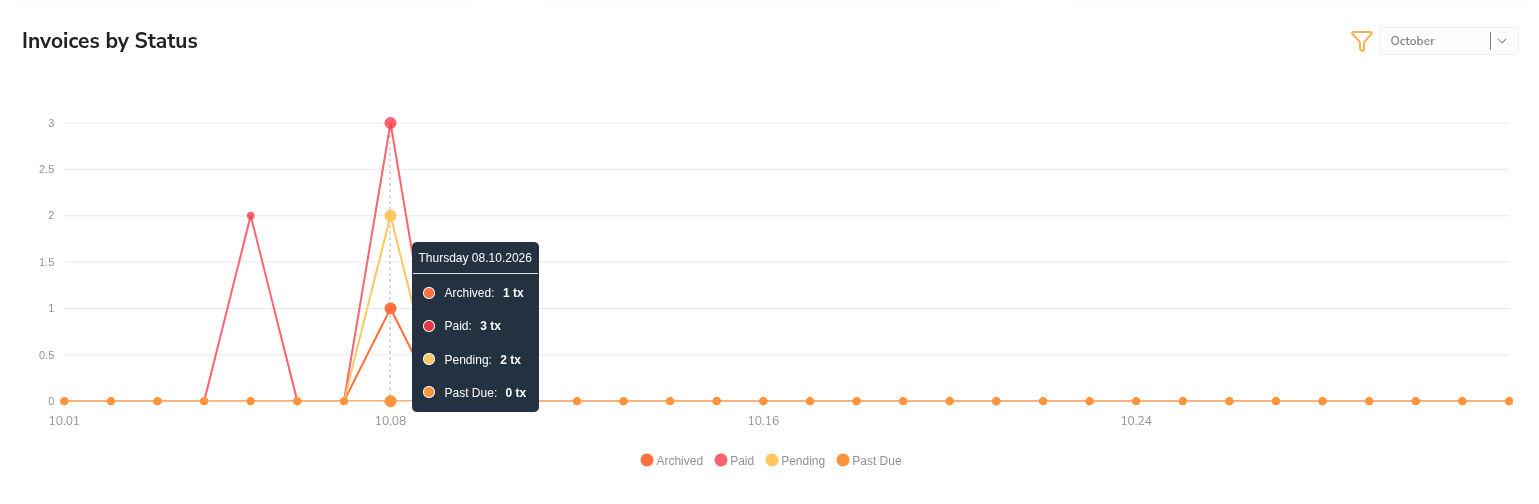
Invoices by Status chart shows you the number of your Invoices grouped by status. It can be displayed in two sizes.
Medium size: You can see the number of Invoices on a given week by status.
Week dropdown: Choose the week that you wish to see. It is set to the current week by default. You can even choose a custom week to display. The previous week will be the week before the chosen one.
Filter: Filter for Invoice statuses. They are displayed with different colors for easier distinction.
Large size: You can see the number of Invoices on a given day by status, displayed for a whole month.
Month dropdown: Choose the month that you wish to see. It is set to the current month by default.
Filter: Filter for Invoice statuses. They are displayed with different colors for easier distinction.
Top 5 Invoices Partners
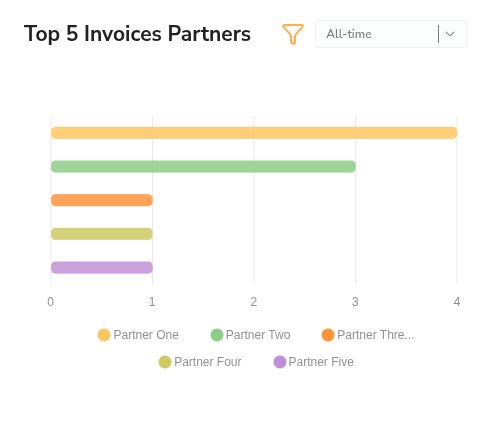
Top 5 Invoices Partners chart shows you the 5 Partners with the highest number of Invoices. The displayed period shows you all-time data by default.
Period dropdown: Choose the period that you wish to see. You can choose from All-time, This week, Last week or Two weeks earlier. You can even choose a custom period to display.
Form Charts
Form Entries
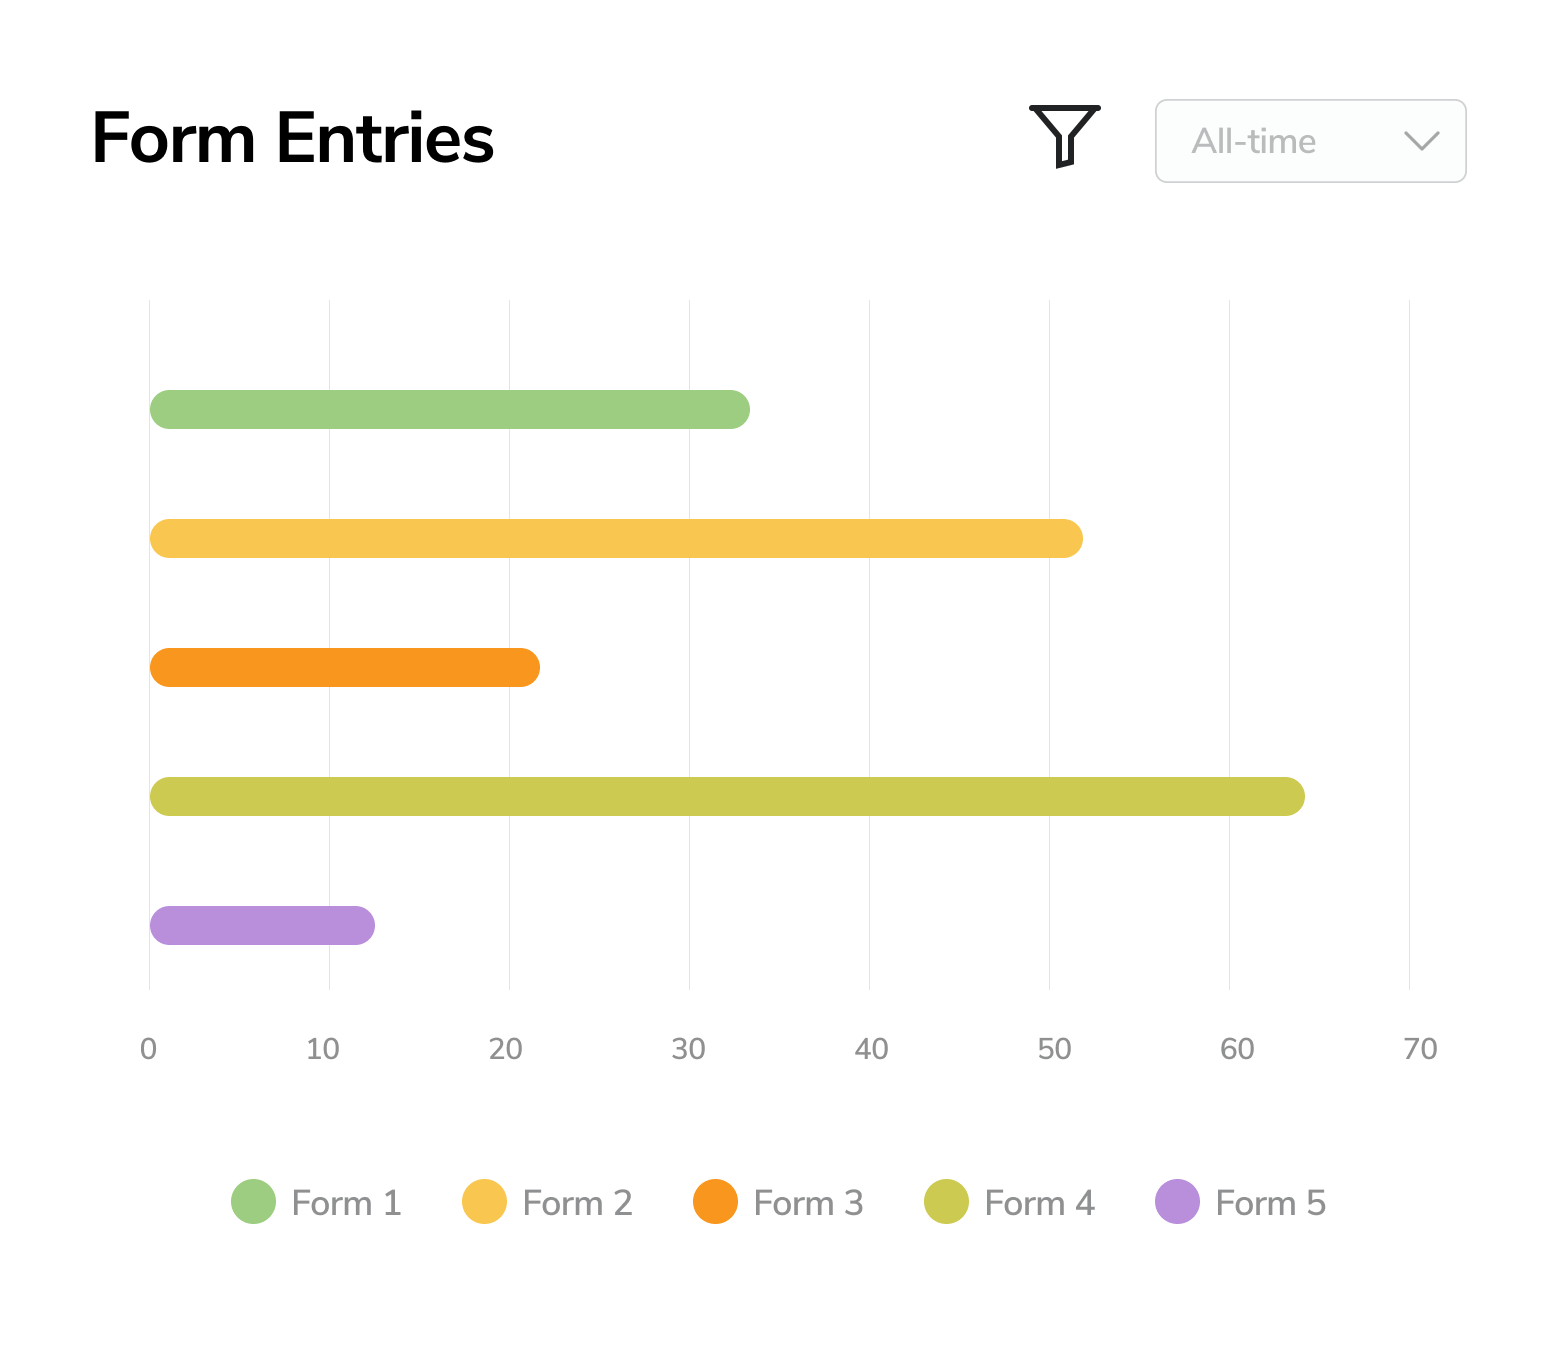
Form Entries chart shows you the number of entries or responses for your Forms. The displayed period shows you the current week.
Week dropdown: Choose the week that you wish to see. It is set to the current week by default. You can even choose a custom week to display. The previous week will be the week before the chosen one.
Filter: Filter for your Forms. They are displayed with different colors for easier distinction.
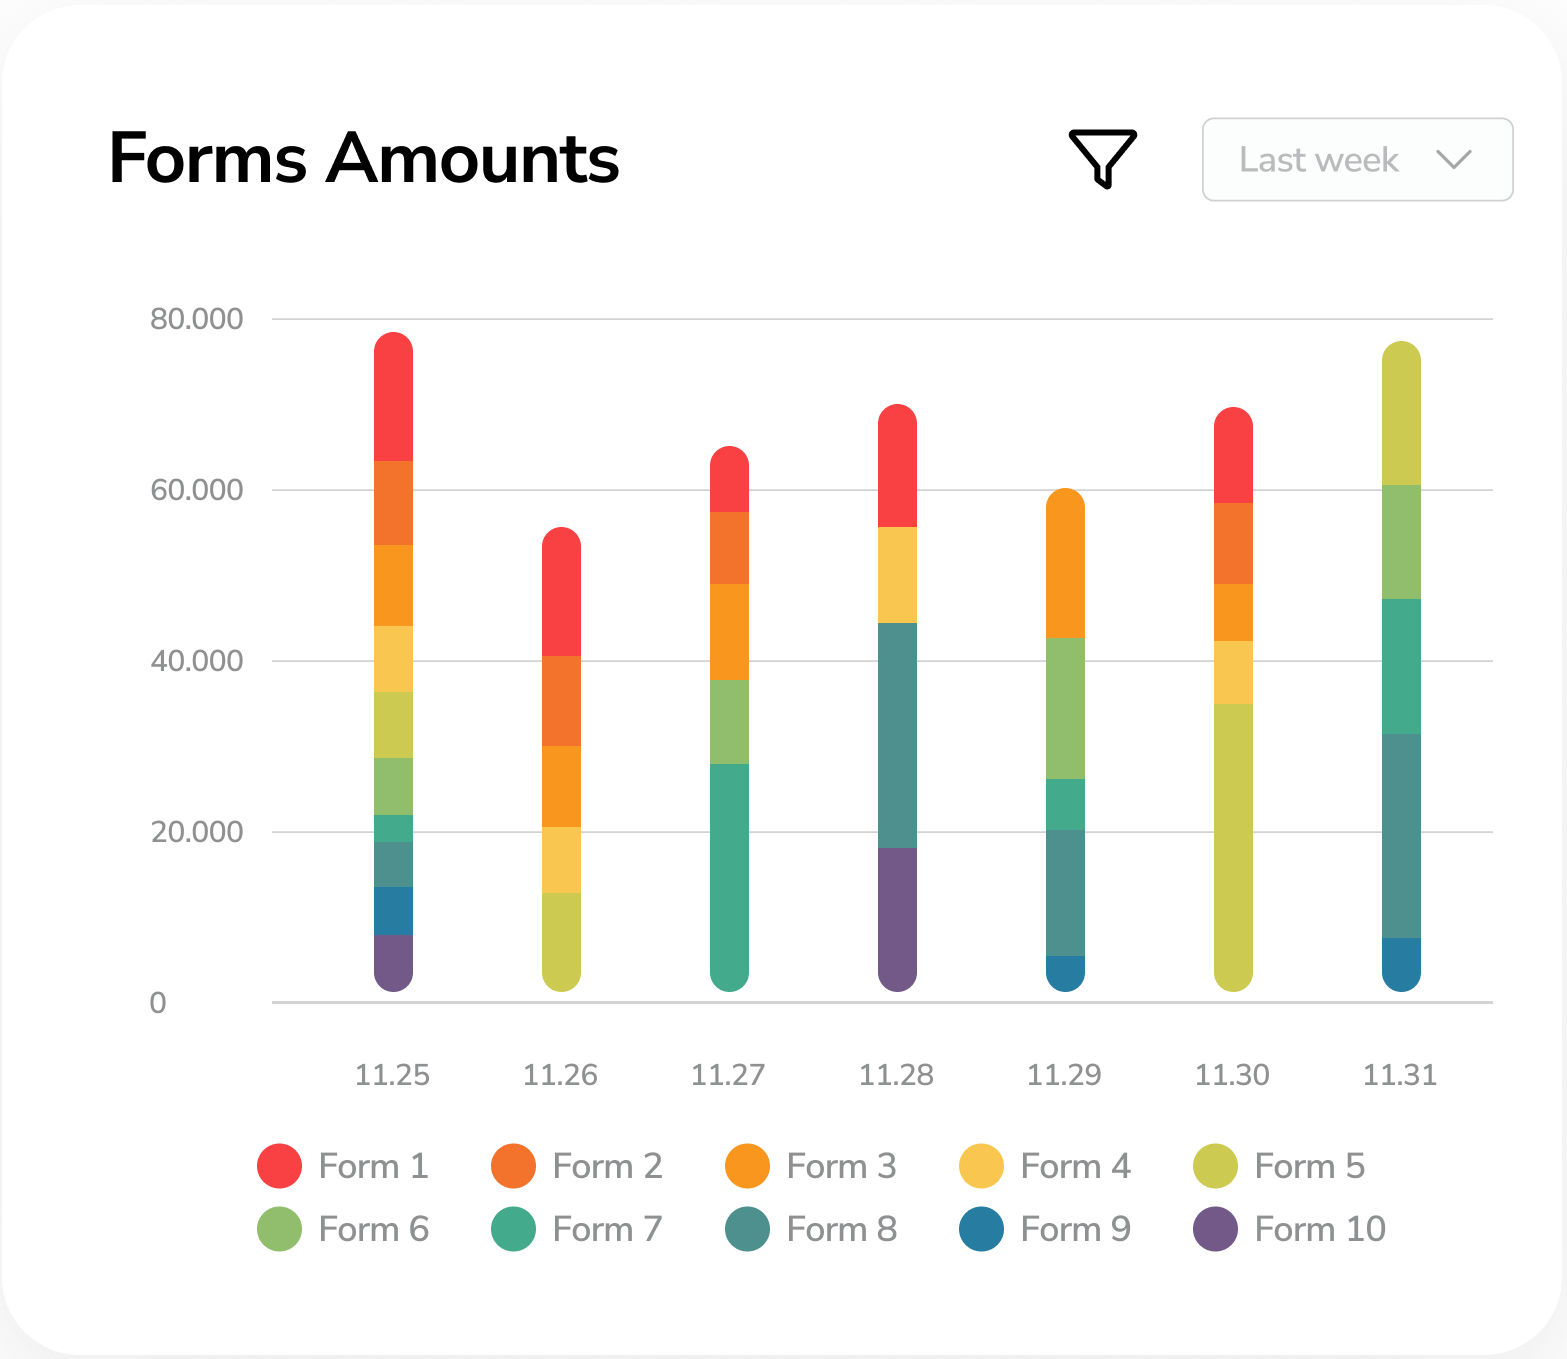
Form Amounts
Form Amounts chart shows you the amount of transactions related to your Forms. The displayed period shows you the current week and the week before in daily distribution.
Week dropdown: Choose the week that you wish to see. It is set to the current week by default. You can even choose a custom week to display. The previous week will be the week before the chosen one.
Filter: Filter for your Forms. They are displayed with different colors for easier distinction.
Detailed Form Amounts
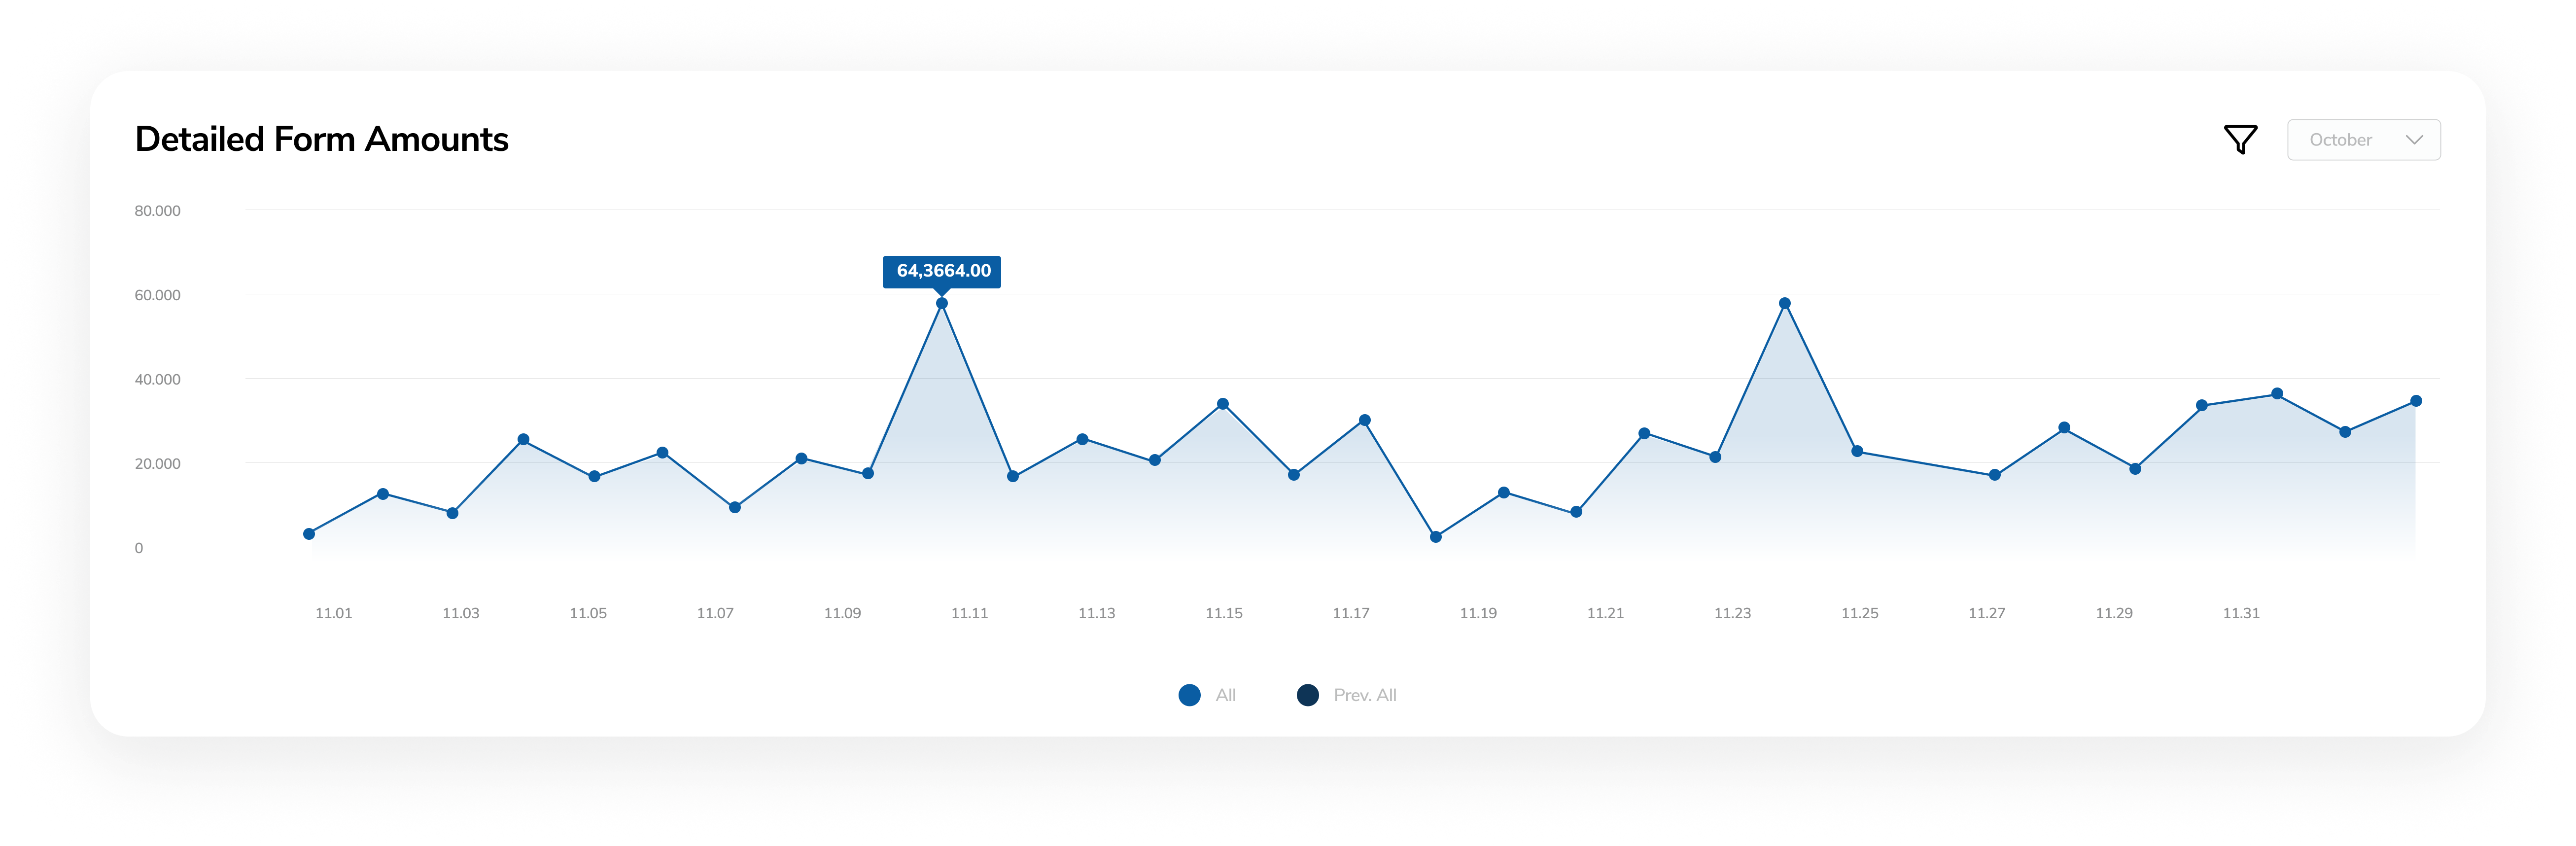
Details Form Amounts chart lets you see the number of transactions on a given day displayed for a whole month.
Month dropdown: Choose the month that you wish to see. It is set to the current month by default.
All and Previous all: Hovering over a given day, you can see the current month compared to the save month of the given year.
Filter: Filter for your Forms. They are displayed with different colors for easier distinction.